
Digital Oceans - Mysteries of The Big Blue
How will the world’s oceans react to the warmer climate? This is just one of the many questions that can be addressed by building digital versions of the oceans.
We all know that the world is on route for a global warming of at least two degrees Celsius. However, this often-repeated figure is an average across the entire planet. Some locations will hardly see any difference, while others will really feel the heat has been turned on. The number one reason for the uneven distribution of the heat lies in the Big Blue – the world’s oceans.
Huge ocean currents not only move massive amounts of water around, but also redistribute the heat received from the sun. In some places, the major currents have a cooling effect – possibly mitigating the effect of global warming – while other places they will enhance the warming.
Furthermore, we can expect that the distribution of the additional heat will not follow the same patterns that govern the ocean circulation today. In fact, it is likely that, as temperatures pass certain thresholds, some currents will vanish or reverse direction.
“The ocean is opaque to light and radio waves and most of what we know about it was wrestled from its abyssal depths in month-long expeditions, braving hurricanes and icebergs.”
Building a silicon ocean
In principle, we could view global warming as a full-scale experiment, and just wait to see how things unfold. This approach is definitely not recommendable. Consequences in terms of natural disasters – floods, droughts, hurricanes etc. – are potentially huge, just like changed conditions for agriculture and fisheries will leave humankind to starve unless timely adjustments are found.
But how can we try and predict what will happen as the globe heats up over the coming decades? The ocean is opaque to light and radio waves and for a long time, most of what we know about it was wrestled from its abyssal depths in month-long expeditions, braving hurricanes and icebergs.
Unfortunately, the types of information obtained in this way did not easily translate into a description of the overall circulation governing the ocean currents.
However, by the late 1990’ies affordable large-scale computing entered the scene. By now, we are able to do numerical simulations which realistically represent ocean physics and dynamics: we can build a “digital twin” of the ocean, which can then be used to study what happens if the ocean warms or
becomes more acidic?
Interaction at different length scales
As a science, physical oceanography faces two fundamental challenges: the turbulence closure problem, and complexity. The former refers to the fact that the structure of the largest currents depends sensitively on the properties of turbulence on the millimeter scale.
The latter results from the interaction of processes on the same scale; for example, the Kuroshio – the Pacific’s equivalent of the Gulf Stream – has two different states, and each state can be maintained for several years in a row.
Obviously, a digital ocean does not only interest climate scientists. We will now be able to study a range of features which we previously could only poorly quantify, or maybe did not even know of, like abyssal storms, rogue waves or maelstroms. Not to mention the vast consequences for fisheries which almost any changes in the ocean will have.
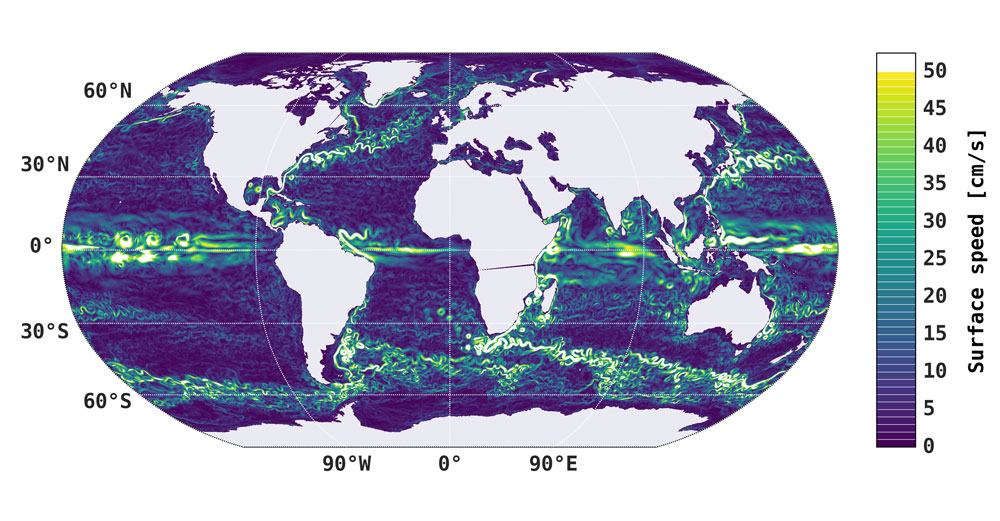
As in the atmosphere, much of the heat in the ocean is not transported by currents or jets, but by storms or turbulence. The picture shows the instantaneous surface speed of the ocean in the NBI ocean model. Bright wiggles are ocean storms. These storms are most prominent around Antarctica, and it turns out that these storms contribute to the rapid melting of the Antarctic ice sheet from below.
The simulations of TeamOcean at NBI have finally allowed to determine the strength of these storms as a function of Earth’s climate (Poulsen et al 2018), and the storms’ contribution to ice sheet melt.
In the model, the ocean is represented by 100,000,000 points. The simulations required continuous use for two years of 5,000 processors of one of the world’s biggest supercomputers. A new generation of models is being developed. They will be 100 times larger.
It will require the brightest minds of this generation to develop an analytical framework that combines the output from these models with the theoretical framework of turbulence and fluid dynamics.